
Optimize code performance quickly
Go from reactive profiling to proactive optimization. Find and fix bottlenecks in your codebase before they slow down production.
Go from reactive profiling to proactive optimization. Find and fix bottlenecks in your codebase before they slow down production.
Performance bottlenecks sneak up on you. Your API was fast last week, but now it's timing out. User dashboards that load instantly are suddenly crawling. The payment flow that worked fine in testing chokes under real traffic.
Traditional code optimization requires deep expertise: understanding profiler output, analyzing algorithmic complexity, correlating performance metrics with business logic. Each optimization cycle means profiling, analyzing, implementing, testing—stretching performance improvements across multiple sprints.
Here's how to turn reactive performance fixes into proactive optimization that prevents bottlenecks before they impact users.
Performance optimization typically starts when users complain or monitoring alerts fire. Developers reach for profiling tools like Chrome DevTools, New Relic, or Datadog to identify where applications spend time. You examine flame graphs, identify CPU hotspots, and correlate slow functions with business logic.
Profiling reveals where time gets spent but not why specific code paths are inefficient. Production profiling requires careful sampling to avoid impacting performance further, leaving you with data pointing to slow functions without clear optimization paths.
Next comes systematically reviewing code for nested loops, inefficient data structures, and redundant operations. This means calculating time complexity and replacing brute-force solutions with optimized implementations.
The challenge is that this requires deeper codebase knowledge, and modern codebases can contain upwards of hundreds of thousands of lines. Critical bottlenecks hide in unexpected places that escape initial review.
To better stress-test applications, developers create traffic simulations to establish performance baselines, implement improvements, then measure throughput and latency changes under simulated production load.
Accurate load testing needs sophisticated environment setup and realistic data generation. The cycle of implementing changes, deploying to test environments, and collecting metrics extends optimization projects across multiple sprint cycles.
Incremental refactoring replaces inefficient code with proven alternatives by optimizing database queries, implementing caching, and refactoring algorithms.
This approach minimizes deployment risk but requires coordination across multiple engineers and extensive testing. Large-scale optimizations span repositories and demand understanding complex interactions between system components.
Many development teams are moving beyond reactive profiling tools toward proactive performance engineering with AI coding assistants like Claude. These tools analyze functions instantly, identify algorithmic bottlenecks, and provide ways to improve your code. You can work with Claude in two ways:
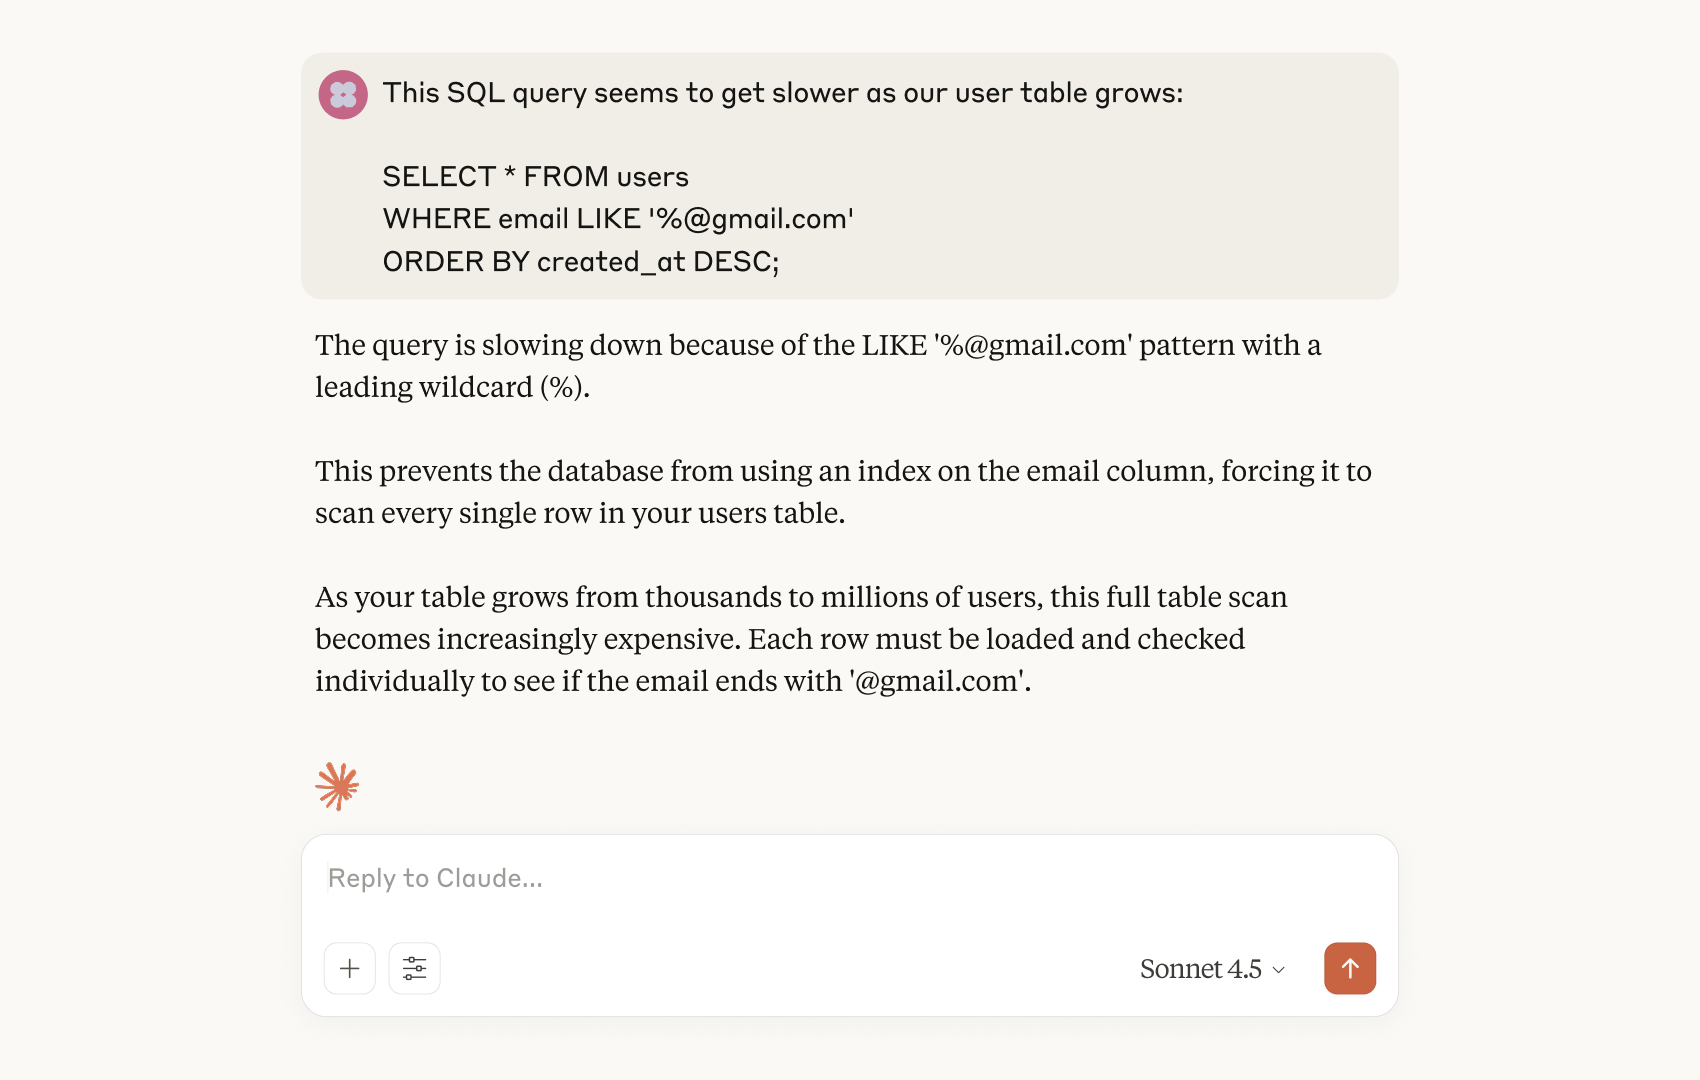
Before setting up complex profiling environments or writing benchmark suites, paste short code snippets in Claude.ai to quickly determine whether a performance issue is algorithmic, structural, or configuration-related. Unlike traditional profilers that only show where time is spent, Claude explains why code is slow and how to fix it. This initial analysis helps you decide between a quick code change or a comprehensive architectural review.
The most straightforward approach with Claude.ai is copying a problematic function and asking for help. Developers typically paste anywhere from a few lines to entire functions that are causing bottlenecks in their applications. Claude analyzes the code structure, identifies inefficient patterns like nested loops or redundant operations, and suggests specific optimizations.
User: "This function is slowing down our user dashboard. How can I make it faster?"

[pastes 20-line function with nested loops]

Claude: "I see two main bottlenecks here: 1. The nested loop creates O(n²) complexity 2. You're making a database call inside the inner loop Here's an optimized version using a single query and hash map lookup..."
Typical questions that work well:
Sometimes you need to understand the root cause before jumping into optimization. Claude.ai excels at breaking down performance issues in accessible language, explaining exactly why certain code patterns become bottlenecks as your application scales. You can paste code that's consuming excessive memory, causing API timeouts, or degrading under load, then ask Claude to explain what's happening.
For performance challenges spanning multiple files or requiring architectural changes, Claude Code agentically provides project-wide optimization capabilities that traditional profiling tools can't match.
Install:
npm install -g @anthropic-ai/claude-codeLaunch in your project:
claudeStart asking Claude about ways to optimize your code:
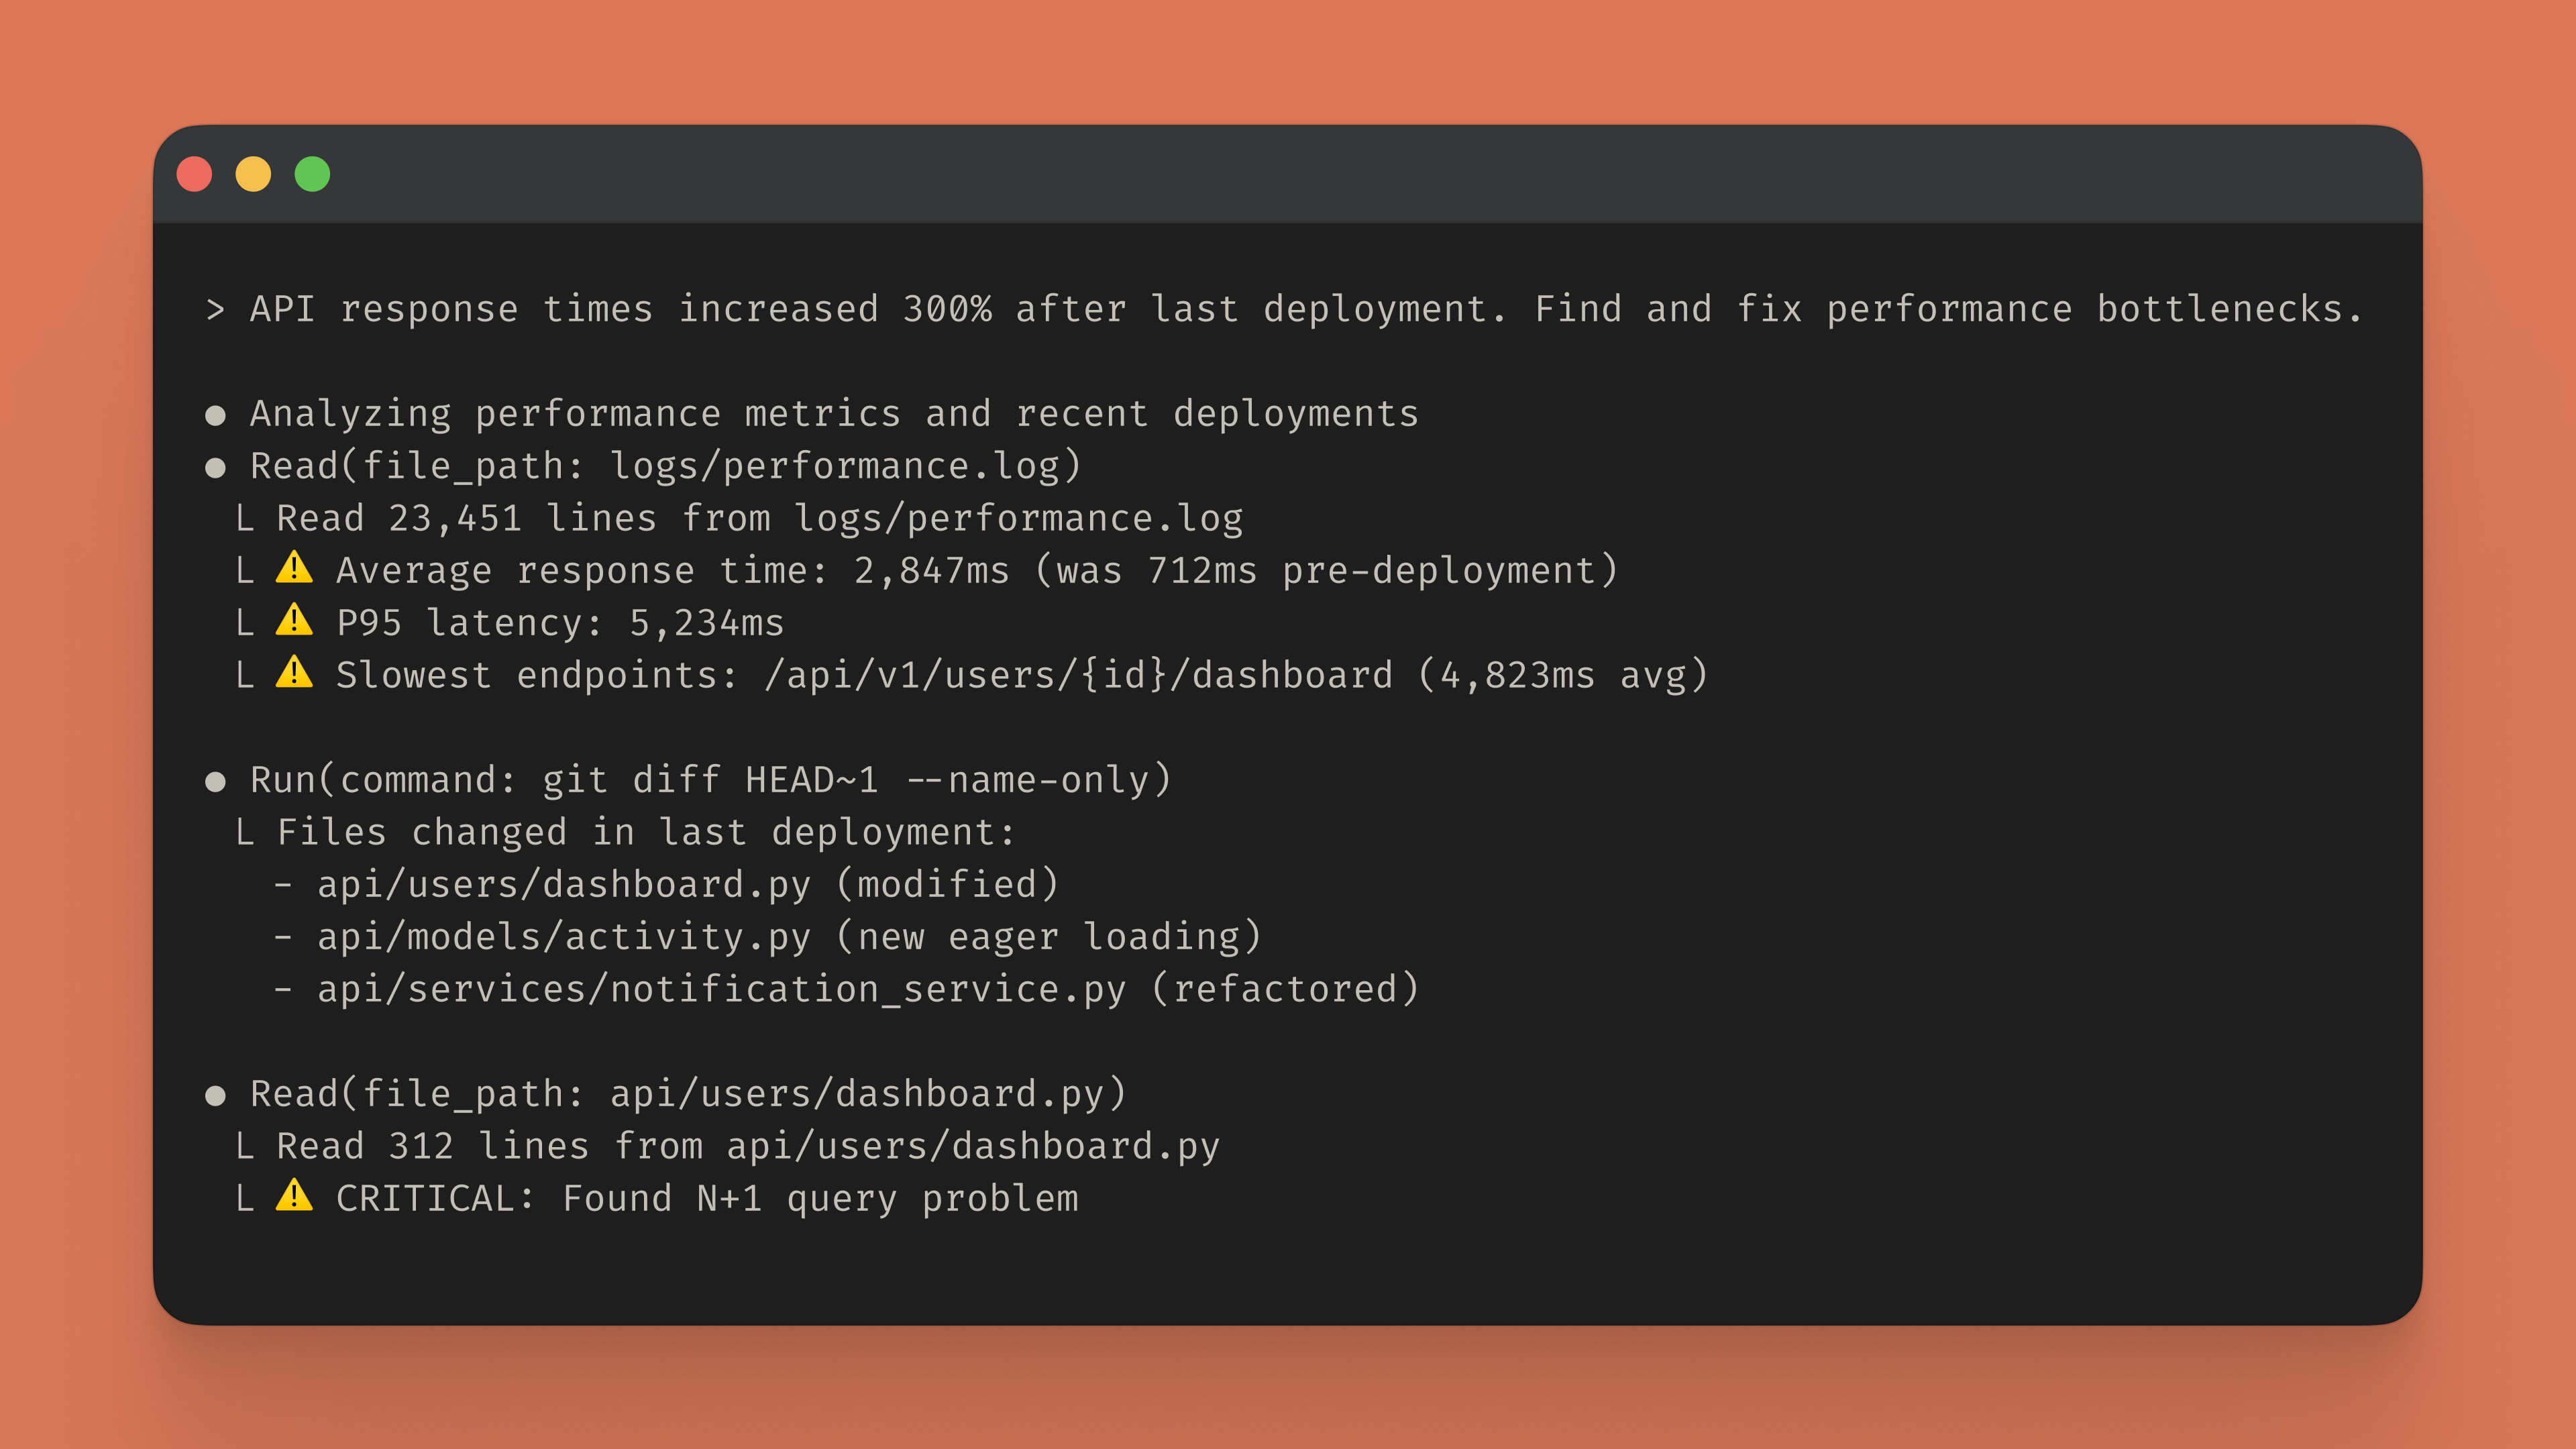
Claude Code autonomously analyzes your entire codebase, correlates recent changes with performance degradation, and provides specific optimization recommendations targeting root causes rather than symptoms.
Once Claude Code identifies bottlenecks, it orchestrates targeted fixes by automatically creating a step-by-step workflow to generate tests, validate improvements, and prevent regressions.
> Optimize this payment processing function and benchmark resultsClaude Code identifies inefficient algorithms, suggests optimized implementations, and can write benchmark code to help you measure performance improvements.
Claude Code optimizes workflows in large codebases, updating code to increase efficiency:
Focus on critical paths: Run Claude Code inside performance-critical directories (api/, core/) avoiding analysis of static assets or configuration files that don't impact performance.
Apply systematic patterns: Claude Code identifies recurring inefficiencies and suggests architectural improvements addressing multiple bottlenecks simultaneously: connection pooling, strategic caching, optimized database query patterns.

Claude Code scans your codebase for loops triggering database queries, identifies specific ORM patterns causing N+1 problems, implements eager loading or batch query solutions, measures query reduction and response time improvements, generates tests preventing N+1 regressions.
Claude Code typically identifies additional optimizations such as adding composite indexes on frequently queried columns or implementing Redis caching for repeated queries.
Claude.ai: Use Claude.ai when you're investigating a specific slow function, validating an optimization approach, or need quick analysis without environment setup. The browser interface makes it ideal for sharing optimization ideas with others or getting second opinions on performance tradeoffs.
Claude Code: Use Claude Code when performance issues span multiple files, require coordinated changes across services, or need automated testing to verify improvements. The terminal integration is essential for implementing optimizations that touch database schemas, API contracts, or caching layers.
Ramp uses Claude Code to accelerate delivery across hundreds of services.
Results:
"When we discovered Claude Code, our teams immediately recognized its potential and integrated it into our workflows"
— Austin Ray, Senior Software Engineer at Ramp
Immediate performance analysis: Visit Claude.ai, paste slow functions, get instant complexity analysis and optimization recommendations.
Comprehensive optimization: Install Claude Code:
npm install -g @anthropic-ai/claude-codeWhether you're targeting sub-100ms API response times, reducing memory consumption, or eliminating database bottlenecks, Claude serves as your thinking partner to ship faster, more efficient software without extending development cycles through manual optimization guesswork. Get started today.

Get the developer newsletter
Product updates, how-tos, community spotlights, and more. Delivered monthly to your inbox.


