Research and compare travel destinations
Create a visual comparison spreadsheet from research with images, ratings, and insights to simplify your travel planning.
With Claude, you can conduct research that would typically take hours across multiple tools—searching sites, taking notes, and organizing data—all within a single conversation. Describe the options you're comparing and get back structured spreadsheets.
Tell Claude which destinations you're considering, when you're traveling, and what matters most to you. Ask for a comparison spreadsheet that covers the dimensions you care about—culture, costs, activities, food, relaxation, ideal trip length, and more.
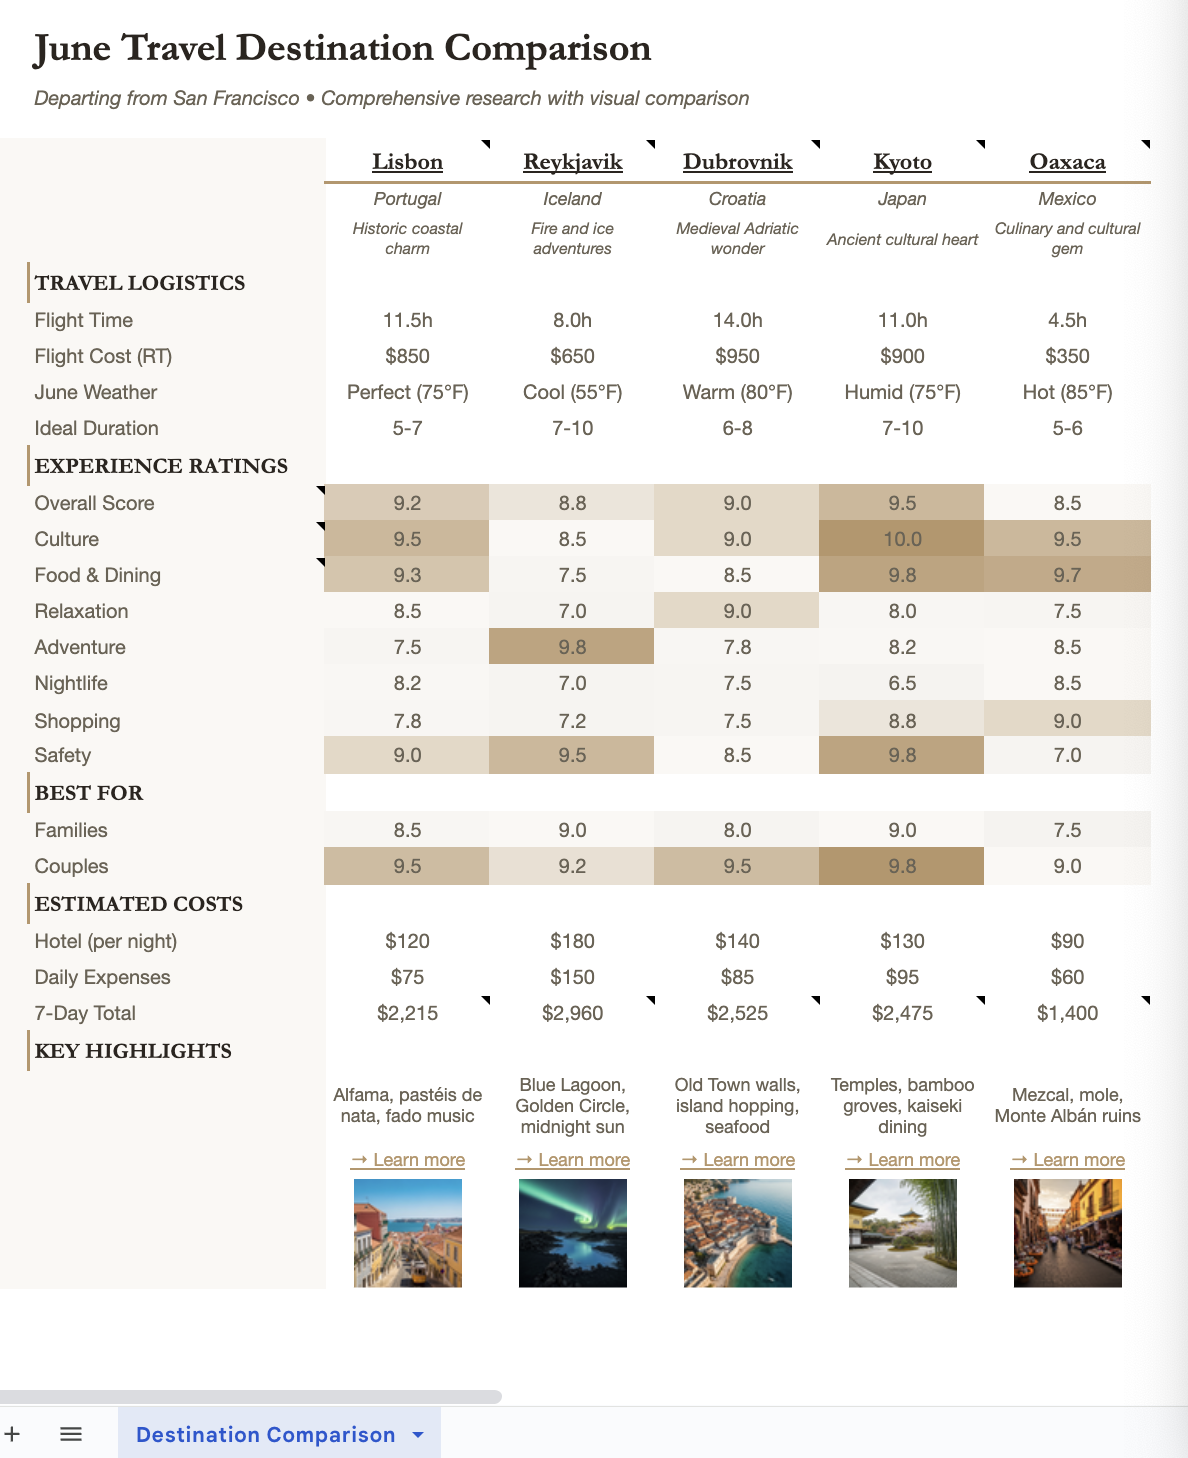
I'm planning a June vacation leaving from San Francisco, and I'm deciding between 5 destinations: Lisbon, Reykjavik, Dubrovnik, Kyoto, and Oaxaca.
Can you research these places and create a comparison spreadsheet that helps me visualize the differences across various dimensions? I want to see them side-by-side so I can compare easily.
Use color-coding or visual indicators to help me spot patterns quickly (like heat maps). Include hyperlinks to official tourism sites so I can learn more, and add cell comments explaining ratings when it's helpful and a small image of the place at the top (small, thumbnail sized photos - verify and resize if too big).
Make it look really polished and professional - something I'd feel confident sharing with my travel group. The layout should be clean and sophisticated - think premium travel magazine quality, not a basic spreadsheet. I want all five destinations visible at once so I can compare them easily.
Claude can use search online to find current travel information and generate a sophisticated spreadsheet file, with features like conditional formatting, formulas, and embedded images.

Toggle Web Search on in the chat bar before starting. Claude will handle the research and design the spreadsheet simultaneously.
For deeper analysis and more thoughtful design decisions, turn on Extended Thinking.
Claude researches each destination comprehensively and produces a multi-sheet spreadsheet file with visual comparisons, detailed ratings across 10+ dimensions, cost breakdowns, and direct links to tourism resources—all correctly formatted with design elements that makes your decision clear.
I've researched all five destinations and created a side-by-side comparison spreadsheet for your June trip.
What's inside:
Layout: All five destinations appear as columns so you can compare at a glance. Each destination has a small thumbnail image at the top, then ratings, travel logistics, and budget details flow down the rows.
Sections included:
Visual features:
View your destination comparison
If certain factors matter more to you—like adventure activities or family-friendliness—Claude can reweight the analysis, add new dimensions you care about, or adjust the criteria to match your specific priorities.
The current ratings weigh all factors equally, but I care most about culture and food. Can you add a 'weighted score' column that emphasizes those dimensions? Also add a 'language barrier' rating since I don't speak these languages.
Claude can transform the spreadsheet data into a visual presentation for group decision-making.
Create a PowerPoint presentation from this analysis—one slide per destination with key stats, images, and pros/cons. Make it visual and compelling since I'll be presenting to my family to decide together.
Once you've chosen a destination, Claude can research and build a day-by-day itinerary.
I've decided on Lisbon! Can you create a 7-day itinerary with specific recommendations for temples to visit, neighborhoods to explore, restaurants for each meal, and day-trip options? Include approximate costs and booking information.
If you want a specific Excel feature, just ask for it by name. Claude can add heat maps, frozen panes, data bars, dropdown filters, conditional formatting, clickable links, cell comments, formulas, charts, and more. Simply mentioning what you need—"add heat maps to show patterns" or "include dropdown menus for filtering"—ensures you get the functionality that makes your spreadsheet work the way you want.
For better results the first time, include a quality check in your prompt: "Make sure column widths and row heights accommodate the content, and images are properly sized as small thumbnails that don't overlap text." This prompts Claude to review its own work and catch common spreadsheet issues—text getting cut off, images covering data, cells that are too cramped or too spacious. Adding "verify everything displays correctly" to your request helps Claude catch these details before you open the file.
Travel information changes constantly—prices fluctuate, attractions update hours, conditions vary. With Web Search enabled, Claude researches current information from multiple sources rather than using older training data. This matters especially for costs, seasonal weather, recent reviews, and travel advisories.