Analyze patterns in user feedback
Find recurring themes and pain points across user feedback to separate meaningful patterns from noise.
Claude can read through all your customer feedback to aggregate and analyze your data in one place. Let Claude do the exhaustive reading and sorting so you can spend time focusing on improving user experience.
Tell Claude which feedback sources to analyze and the questions you're trying to answer. Claude reads all your data at once and identifies themes across hundreds of comments. It then synthesizes everything into workbooks that make qualitative feedback actionable.
Pull all Intercom conversations from the past 90 days. I'm also uploading our Q2 NPS survey responses (CSV) and notes from six user interviews we did last month (Word docs).
Read everything and tell me what patterns you're seeing:
Create a data workbook (Excel) organizing all the feedback by theme with filters so I can dig into specific issues. Include the source for each piece of feedback (Intercom, NPS, or interview) and use professional formatting with frozen headers
Connect tools where your support and feedback lives using connectors so Claude can access and analyze your data.
In Settings > Connectors, find and enable your Intercom connector.
Upload supplementary feedback that lives outside your tools—NPS responses, interview transcripts, feedback forms, user research notes.
Click the (+) button in the chat bar to browse through your files, or alternatively, drag and drop files into the chat box area.


Turn on Extended Thinking for deeper pattern recognition across hundreds of feedback points.
Claude connects dots between your feedback sources and organizes everything into data workbooks that make qualitative feedback actionable.
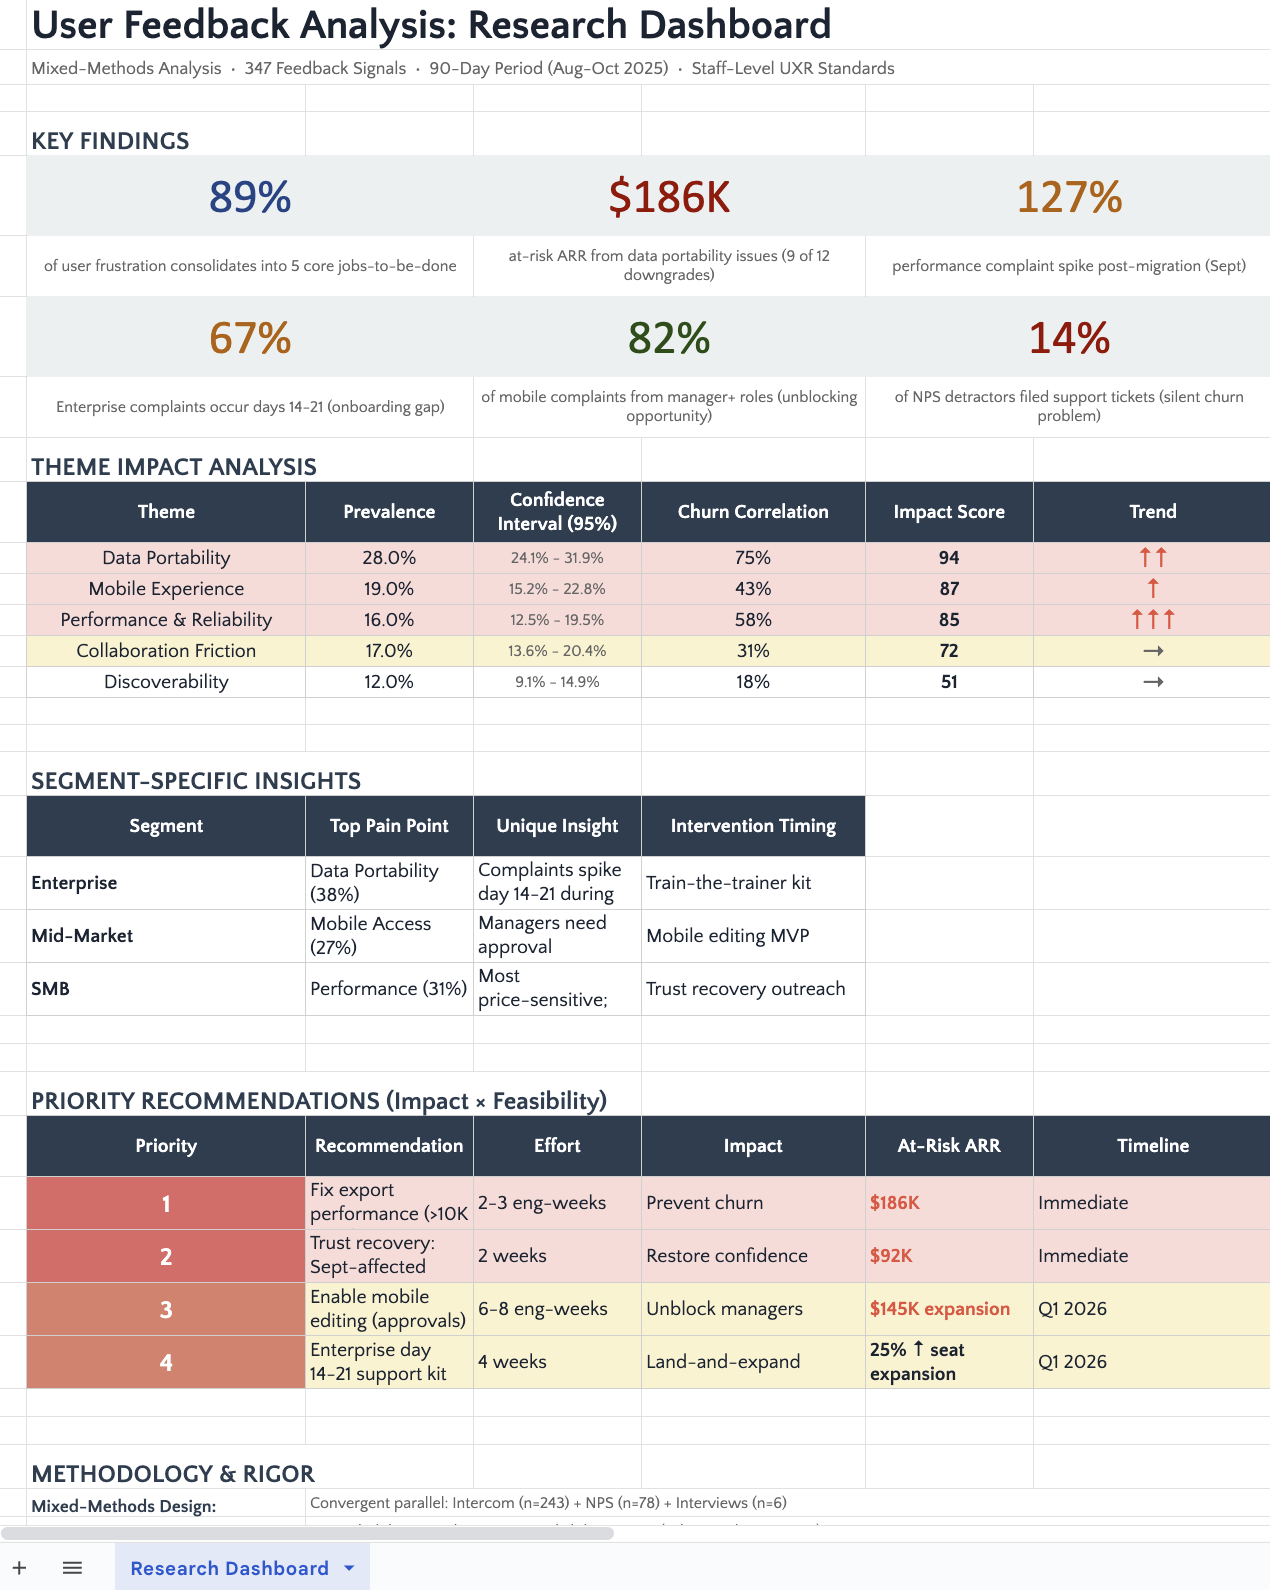
I've analyzed 347 feedback points across your support tickets, NPS responses, and interview transcripts.
View your data workbook
Claude responds to design language and quality cues by applying sophisticated formatting, typography, and visual elements. Review first outputs, then request elevated quality with specific design direction.
Add visual polish to these files. For the document, refine with premium typography, sophisticated color schemes, and tighter formatting. For the spreadsheet, add charts to visualize trends, comparison tables, and callout boxes for key insights.
Break analysis down by meaningful groups to see how patterns differ. Claude identifies which issues matter most to specific segments, helping you prioritize high-value users or unique needs.
Take the top three pain points and show me how they differ between enterprise and SMB customers. Are we solving the right problems for our highest-value segment?
Turn workflows you’ve refined into reusable skills that bundle your instructions, templates, and preferences. Skills eliminate repetitive explanations and ensure consistent outputs for tasks you do regularly.
Help me create a skill for analyzing user feedback. I want to capture where I pull data from, my analysis methodology, and the output structure I prefer—so I can reuse this process without re-explaining it every time.
Don't spend time formatting feedback into perfect columns before uploading. Claude handles messy data, like mixed formats, incomplete fields, typos, even handwritten notes you've transcribed. Focus your energy on collecting comprehensive feedback, not cleaning it.
Claude will tell you what's in the data, but you need to interpret whether the sample represents your actual user base. Power users may leave more feedback than typical users. Enterprise customers have dedicated account managers to channel complaints. Promoters write thoughtful NPS comments while detractors just pick a number. Ask Claude: "What's the breakdown of feedback by user segment? Are we over-indexed on hearing from any particular group?"
Feedback tells you what users say; usage data tells you what they do. The most powerful insights come from connecting both. Upload your feedback analysis to a Claude Project along with usage analytics, then ask: "Users complain about Feature X being slow, but our logs show it averages a fast response time. What's actually happening?"