Write an impact report
Turn raw program data and participant outcomes into compelling narratives with data visualizations, stakeholder-specific insights, and authentic success stories that demonstrate real impact.
AI can transform spreadsheets of outcomes into stories that resonate with donors, boards, and funders. By combining data analysis with narrative development, you get reports that both prove impact and inspire continued support.
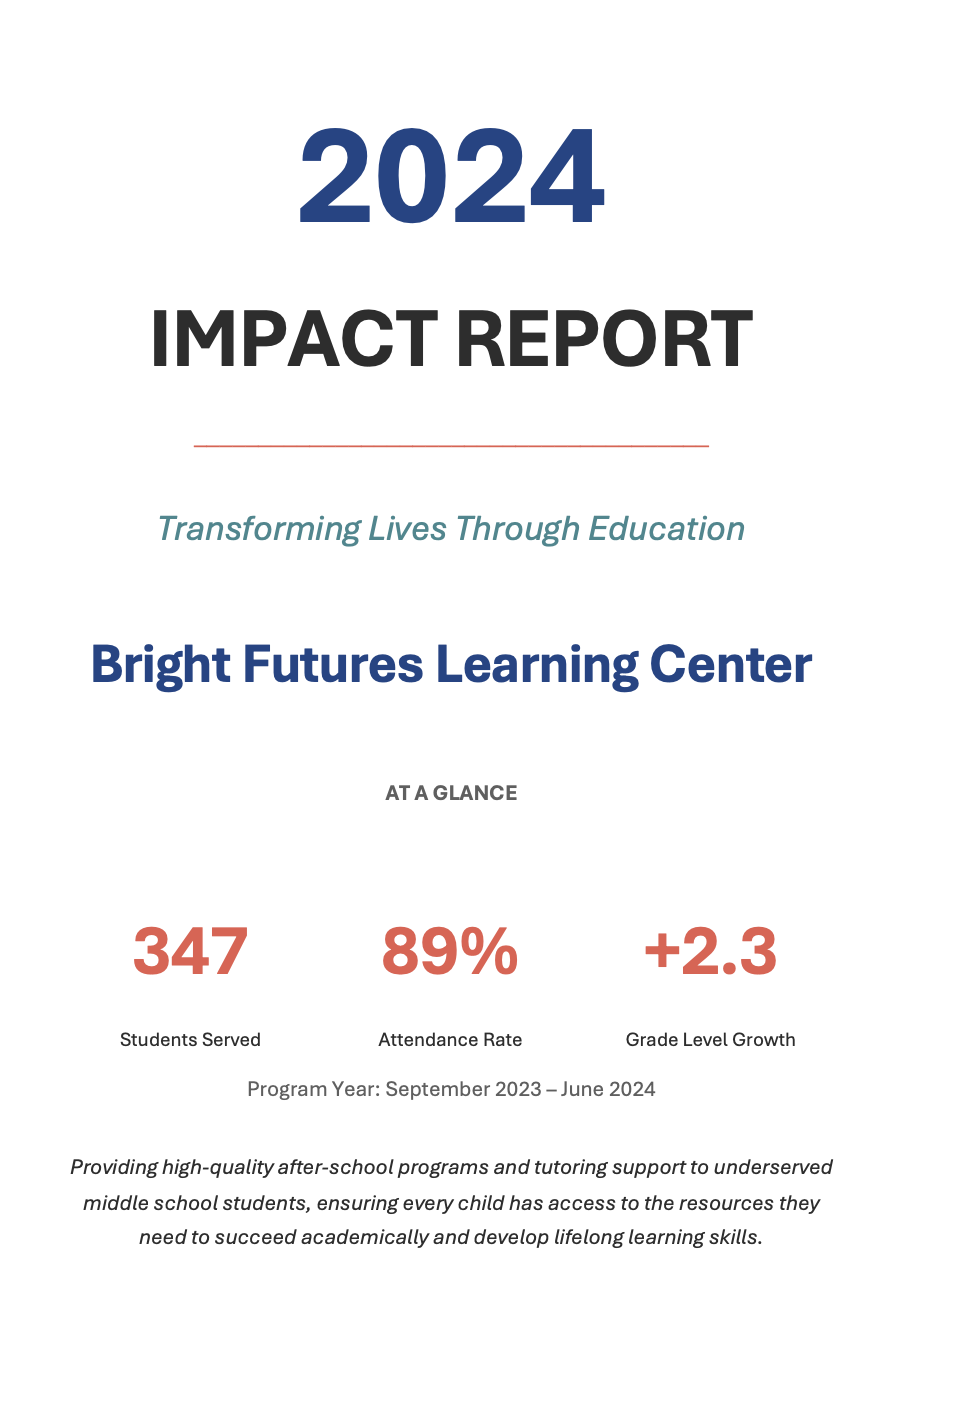
I'm the Program Director at Bright Futures Learning Center, a nonprofit providing after-school tutoring and enrichment programs for middle school students in underserved Seattle neighborhoods. I need to create our annual impact report that will go to our board, major donors, and foundation funders.
I'm uploading our program data: student enrollment and demographics, attendance records, academic assessment results (pre/post test scores), volunteer hours, and our financial summary. We served 347 students this year across three locations.
For the report, I need:
Make this board-ready and donor-worthy. Use sophisticated design that matches the quality of professional nonprofit reports—this goes to foundation program officers who see dozens of these. Include charts and visual elements that make the data immediately clear. The tone should be confident about our achievements while staying authentic and mission-focused.
Provide your raw program data so Claude can analyze outcomes, identify patterns, and build compelling narratives around real results.
Upload spreadsheets, databases, or documents containing your program metrics.
This typically includes: participant enrollment and demographics, attendance or engagement tracking, pre/post assessment scores or skill development measures, volunteer or staff hours, program satisfaction surveys, financial data (revenue sources, expenses, cost per participant), and any qualitative feedback from participants or families.

Consider the following:● Enrollment & demographics spreadsheets: Student/participant counts by location, grade level, ethnicity, income level, or other relevant categories● Outcome measurement data: Test scores, skill assessments, attendance records, completion rates, or program-specific metrics● Financial summaries: Revenue by source, expense categories, cost-per-participant calculations● Qualitative data: Survey responses, testimonials, case study notes, or participant feedback● Historical comparison data: Previous year metrics to show growth or trends
Claude analyzes your data to find the strongest evidence of impact, then creates a comprehensive report that tells your story through both numbers and narrative.
Your impact report includes:
Executive Summary: Opening section that highlights your biggest achievements, key metrics, and overall impact. Written for busy executives who need the highlights immediately.
Program Overview: Clear description of what you do, who you serve, and how your programs work. Establishes context for readers unfamiliar with your organization.
The report uses sophisticated formatting with intentional typography, a cohesive color palette, professional data visualizations, and clear information hierarchy. Every section balances comprehensive data with scannable presentation—detailed enough for board members who want depth, visual enough for donors who skim.
Ensure a unified voice while tailoring your output for various audiences
Create a foundation-focused version emphasizing measurable outcomes and cost-effectiveness, a donor version highlighting individual stories and community impact, and a board version with strategic insights and operational metrics.
Convert this report into a 10-slide PowerPoint presentation for our board meeting.
Convert this report into a 10-slide PowerPoint presentation for our board meeting. Lead with impact, use visuals heavily, keep text minimal. Include the key data points but focus on story and achievement.
Pull out compelling statistics for shareable social content.
Pull out our 5-6 most compelling statistics and create social media posts. For each metric, write a short caption that explains why it matters. Make them shareable—the kind of content that helps donors understand our impact quickly.
Always verify critical metrics against your source records before distribution. Claude excels at analyzing and transforming data into compelling narratives, but always cross-check critical metrics. Correct information will help ensure stakeholder trust.
Claude can handle messy spreadsheets, incomplete datasets, and varied formats. Providing the actual source data allows Claude to spot trends, calculate metrics, and create visualizations you might not have considered. If you have 500 rows of participant outcomes, upload all 500—Claude can find patterns across the complete dataset that wouldn't be visible in samples.
Foundation officers care about cost-effectiveness and scalability. Board members need strategic insights and risk assessment. Individual donors respond to personal stories and community impact. Tell Claude who will read this and what matters to them. The same data tells different stories depending on who needs to be convinced.
If you're creating a 40-page annual report covering multiple programs, build in stages. First: "Analyze the data and create an executive summary with key metrics." Review that. Then: "Now develop the program outcome sections with visualizations." Then: "Add the financial overview and forward-looking goals." Staged development provides checkpoints and lets you redirect before investing in full execution.