Analyze campaign performance
Analyze campaign performance data to identify your best and worst performing channels, then get specific budget reallocation recommendations for next quarter.
Compiling campaign data across multiple channels into a unified view takes hours of work. Claude handles the consolidation and analysis together, processing multiple data sources to spot channel patterns, identify reallocation opportunities, and deliver actionable recommendations.Tell Claude to analyze your data and create Excel dashboards and Word documents. Be explicit that you need actionable recommendations for next quarter, not just historical summaries. Ask Claude to identify patterns and opportunities in the data—what's working, what's not, and where to reallocate resources.
I'm running three campaigns targeting different customer segments. I have Q3 data showing impressions, clicks, conversions, and spend across social, search, and email.
Analyze performance and tell me:
Create a dashboard and analysis report. I need to know what to do differently next quarter.
Context: Our target ROI is 300%+. Enterprise customers have 3x higher LTV than SMB. Industry benchmark is 200-250% ROI. I can shift up to 30% of budget based on performance.
To make helpful recommendations, give Claude your business context, such as your current and target metrics, as well as industry benchmarks.
Upload any data relating to your campaign performance. Click the (+) button in the chat bar to browse through your files, or alternatively, drag and drop files into the chat box area.

Use Extended Thinking for better results completing complex tasks like analyzing data and creating high quality spreadsheets.
Claude analyzes your marketing data and turns it into a strategic review that tells you where and how you can improve.
I've analyzed the Q3 campaign data across three campaigns, three channels, and three customer segments to identify performance patterns and budget optimization opportunities.
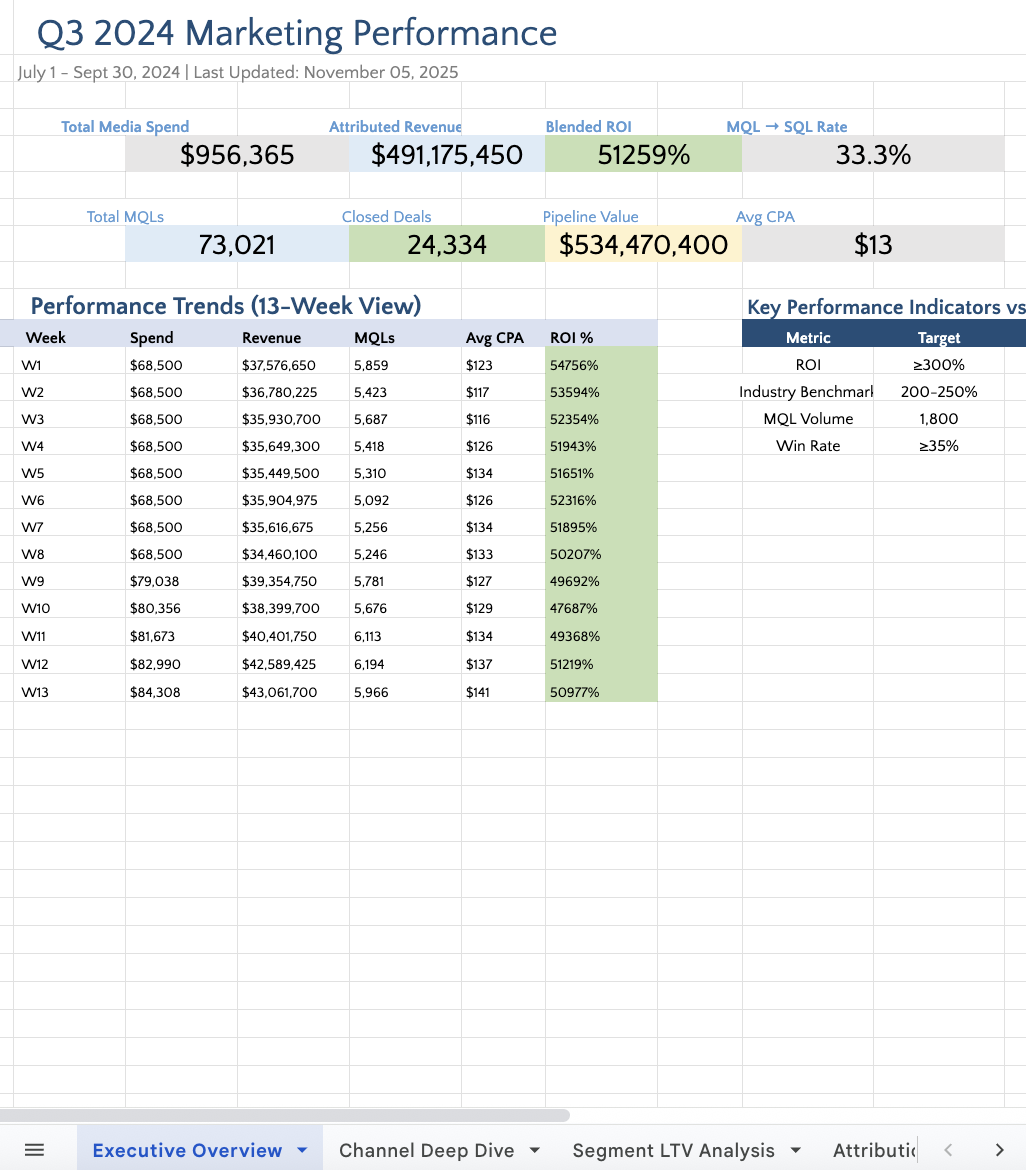
I created an Excel dashboard with executive metrics, campaign rankings using performance-based color coding, and channel breakdowns, plus a detailed analysis document detailing what's working, what's not, hidden opportunities like the enterprise-email synergy, and specific Q4 budget reallocation recommendations projected to increase net profit by $185K.
Excel Performance Dashboard:
Word Detailed Analysis (10-15 pages):
Strategic Recommendations: Q4 Action Plan
Ask Claude to reformat previous analyses so all your dashboards are consistent. Claude preserves your data and insights while restructuring everything to match, creating consistency across your work.
I’'m attaching performance reviews from years prior. Reformat these older reports to match the new structure—keep all the original data and insights, just reorganize into the current template format.
Request visual touches that improve the quality of your outputs.
Enhance the spreadsheet by adding data visualizations ( heat maps to show patterns, charts for larger trends) and dropdown menus for easy filtering.
Use Research to find industry benchmarks and compare performance. Research works differently from a simple search—Claude deep dives across all your connected tools and online sources. This process takes a few minutes but delivers a thorough report with citations you can verify. Having multiple integrations connected gives Research more context to work with, allowing Claude to cross-reference internal knowledge with external market data.
The chat preview shows basic table structure, but the actual spreadsheet contains working formulas, formatting, color-coded cells, and typography that may not appear in chat. Download and open the file to see the full sheet with all formatting intact before requesting changes..
Claude handles messy data so upload data as-is—mixed formats, inconsistent naming, incomplete fields.. Focus your energy on collecting comprehensive information from several channels rather than making everything perfectly formatted.