Visualize database architecture
Visualize database architecture with diagrams showing table relationships, foreign keys, and schema rules.
Claude can parse complex database structures and transform them into clear visual representations, letting you focus on optimizing your data model rather than manually mapping relationships.
Point Claude towards the right GitHub repository and tell it which schema files to analyze.
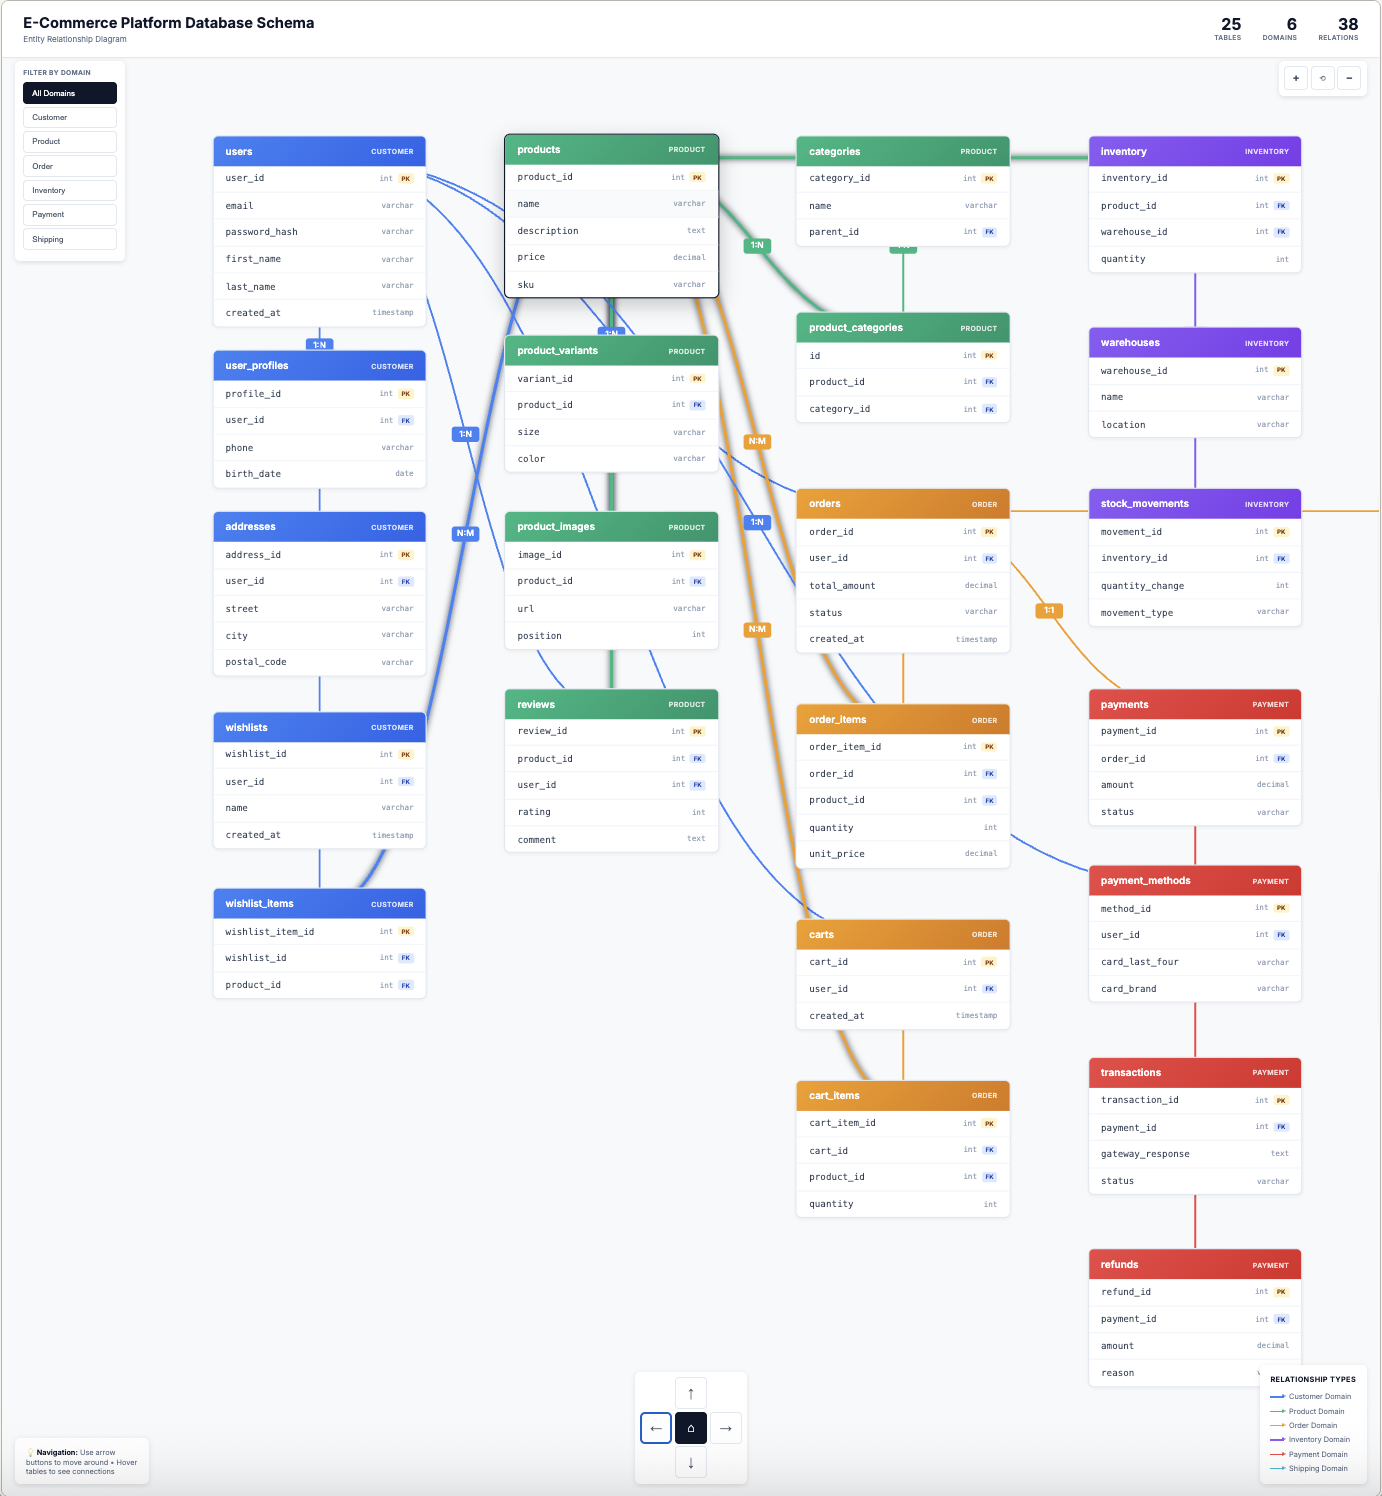
Pull the database schema from our e-commerce repo on Github. The schema files are in /db/migrations/ in the main branch of the company/ecommerce-platform repository. The database has grown organically over 3 years and now includes about 25 tables covering users, products, orders, inventory, payments, and shipping.
Create an interactive ER diagram that shows:
Make it interactive so I can zoom and pan around the diagram easily. Use clean, professional styling with good visual hierarchy so I can quickly understand the structure.
To transform your schema into a visual diagram, Claude needs to parse your table definitions, foreign key relationships, and constraints.
Claude reads your schema files directly from GitHub to map table structures, relationships, and constraints. Connect GitHub to let Claude access your repository—it can then compare schemas across branches, track how your database evolves, or generate documentation when your schema changes.


Turn on Extended Thinking so Claude can spend more time completing complex tasks and creating high-quality outputs.
After analyzing your repo in Github, Claude will generate an interactive ER diagram artifact that visualizes your database structure with zoom, pan, and clear relationship indicators.
Perfect! I've pulled your schema files from company/ecommerce-platform/db/migrations/ and created an interactive ER diagram showing all 25 tables and their relationships.
What's included:
Visual organization
Relationship mapping
Key indicators
Interactive features
The diagram clearly shows how your customer data flows through orders into payments and shipments, making it easy to trace data dependencies and identify potential optimization opportunities.
Using connectors like Mermaid Chart, Claude converts artifact diagrams to editable formats, generates shareable links, and provides portable code for cross-platform embedding and team collaboration
Can you convert this artifact flowchart to Mermaid.js format using the Mermaid Chart tool? I'd like an editable playground link to share with my team and the raw Mermaid code so we can embed it in our docs or export to other platforms.
Claude can expand on certain specific parts of the diagram or enhance with table and column descriptions
Add descriptive labels to each table explaining its purpose. For key tables like orders and payments, include brief descriptions of important columns so new developers can understand the schema more quickly.
Visualize schema changes between branches or commits
Pull the schema from the main branch and from the feature/payment-refactor branch. Create side-by-side diagrams highlighting what's different: new tables, modified relationships, or removed constraints. This helps me review the PR.
For databases with 50+ tables, ask Claude to create multiple focused diagrams rather than one massive view. This makes complex systems more manageable and easier to understand.