Draft investment memos
Generate investment memos from platform data, formatted to match your firm's structure and requirements.
Claude can connect directly to your financial tools, letting you query using natural language and receive analysis with source citations. Instead of opening multiple browser tabs to gather data, copying metrics into spreadsheets, and then formatting a Word document from scratch, you can request the complete workflow in one conversation.
Tell Claude which company you're evaluating, what metrics drive your investment decision, and what deliverable format you need.
I'm evaluating CloudBridge Technologies (ticker: CLDG) for a potential equity investment and need an initial memo for our IC meeting next week.
Pull the data I need: Using Daloopa, get CloudBridge's revenue, operating margins, and free cash flow for the last 12 quarters, plus their segment revenue breakdowns. Using Kensho, identify who CloudBridge lists as competitors in their SEC filings and pull revenue growth and margins for those competitors. Also get CloudBridge's key business relationships and major customers.
Analyze this: Calculate cloud platform segment growth versus overall company growth. Determine free cash flow conversion rate. Compare margins year-over-year. Benchmark CloudBridge against the competitors we identified. Flag customer concentration risks.
Create a professional investment memo in Word format: executive summary with recommendation, business overview with segment analysis, financial performance highlighting trends, competitive positioning, valuation assessment, and key risks. Use IC-ready formatting.
Connect your data platforms so Claude produces memos with current data rather than requiring manual metric gathering from multiple sources.
Use connectors to give Claude access to financial data providers. Browse through the connector library in your settings to find tools from trusted financial partners.
Set up connections to Daloopa for SEC filings and fundamental data, and S&P Global for market intelligence and competitor analysis.
This workflow uses capabilities available to Claude for Enterprise customers. Financial data connectors may require existing subscriptions or licenses with the underlying providers.


In the chat settings, make sure Web Search is turned on for additional context on the company you are evaluating.
Enable Extended Thinking for better synthesis when combining data from multiple platforms and creating higher-quality document outputs.
Claude pulls data from Daloopa and S&P Global, calculates growth rates and margins, compares performance across competitors, and generates a professional Word document ready for investment committee review.
Perfect! I've retrieved the financial data and created your investment memo:
Data Retrieved:
Analysis:
Investment Memo:
View your memo
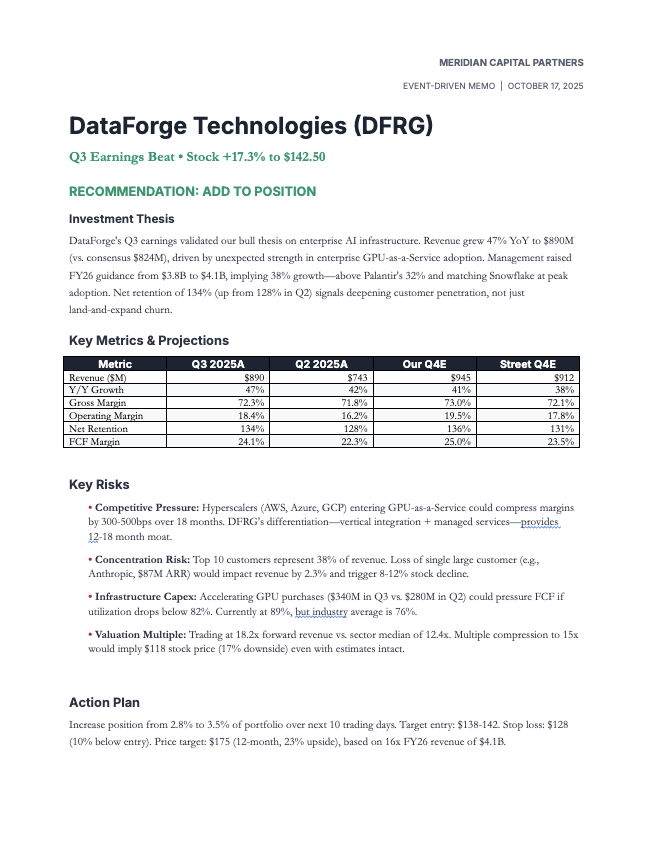
The document includes executive summary with BUY recommendation and $165 target (28% upside), business overview analyzing segment performance, financial highlights showing margin expansion and cash generation, competitive benchmarking table, valuation using three methodologies, and risk assessment with mitigating factors. Formatted for IC presentation with professional typography and clear visual hierarchy.
Get specific platform references and data points for every claim in the memo. Claude can trace every number and claim back to its source, showing you exactly where each piece of information came from.
Cite the exact source for each metric—I need to see platform name, date pulled, and which filing or transcript. Show me where the Q3 revenue number came from, which analyst report supports the margin expansion claim, and the specific competitor data points.
Add detailed calculations and assumptions to support your price target. Claude shows the underlying math and how your valuation changes under different scenarios.
Show me the DCF math step-by-step: revenue assumptions, margin projections, discount rate, terminal value. Then create a sensitivity table showing how the target price changes if growth rates or margins differ from base case by 5 percentage points.
Convert your written memo into slides for your committee meeting. Claude restructures your content and creates charts to illustrate key findings.
Convert this analysis into a 6-slide PowerPoint: title slide with recommendation, business model overview, competitive comparison with charts, financial performance trends, valuation summary, and investment thesis. Visualize trends with visual elements, like graphs and charts.
Claude has access to vast amounts of financial data when connected to multiple tools and sources. Without specific references in your prompt, you may receive more data than needed or miss specific, critical metrics. Provide clear direction to ensure Claude returns the information required for your analysis, saving time and improving accuracy.
The in-chat preview may not show the final typography, spacing hierarchy, and formatted tables that the document has. Open the file to see—and continue editing—the complete output.
This example uses Claude Sonnet 4.5, the Claude model best suited for a balance of intelligence, speed, and cost for most use cases. If you need faster iteration (like rapid brainstorming or simple formatting), consider switching to Haiku 4.5, the fastest Claude model with near-frontier intelligence. To learn more about various models, visit our Model Report.
In addition to the ability to connect to financial data tools, Claude for Financial Services adds expanded services. In addition to financial data connections, receive specialized Skills for institutional-grade analysis and frameworks, such as those for financial analysis or valuation. Also receive expert implementation support through tailored onboarding, training, and best practices.