Organize your business finances
Organize data into spreadsheets that show you trends, let you filter records, and help you understand your numbers.
Claude can create spreadsheets tailored to your needs, applying the right features for your specific situation.
Tell Claude about your freelance business and the metrics that matter. Provide your invoice data—even if it's incomplete or messy—and ask for a dashboard that helps you make smarter business decisions.
I need help organizing my freelance invoices from this year. I'm uploading my invoice file. It has the date, client name, what the project was, and how much I invoiced. Formatting is inconsistent because I've been adding to it all year.
Can you create a cleaner version with a dashboard that shows my total income, breaks it down by month, and lists my clients by who's paid me the most. Add sparklines and data visualizations showing trends over time at a glance. I want to be able to filter and sort to find specific invoices when I need them. If you notice nuance in the data, leave cell comments for more context.
Make this a sophisticated financial dashboard with a "quiet luxury", editorial aesthetic—muted sage green accent, abundant whitespace, restrained typography. You may need to write a Python script using xlsxwriter to get the sparklines and advanced features working.
Give Claude your business records, like invoice information, so Claude can analyze and organize your information and then add spreadsheet features that make understanding your data easy.
Upload your spreadsheet or CSV file with your invoice data.
Click the (+) in the chat bar settings to browse through your files, or alternatively, drag and drop your files into the chat box area.

Turn on Extended Thinking to help Claude spend more time thinking through organization and formatting
Claude organizes your data and adds spreadsheet features—filters, frozen headers, trend charts, and formatting—that make it functional and easy to use.
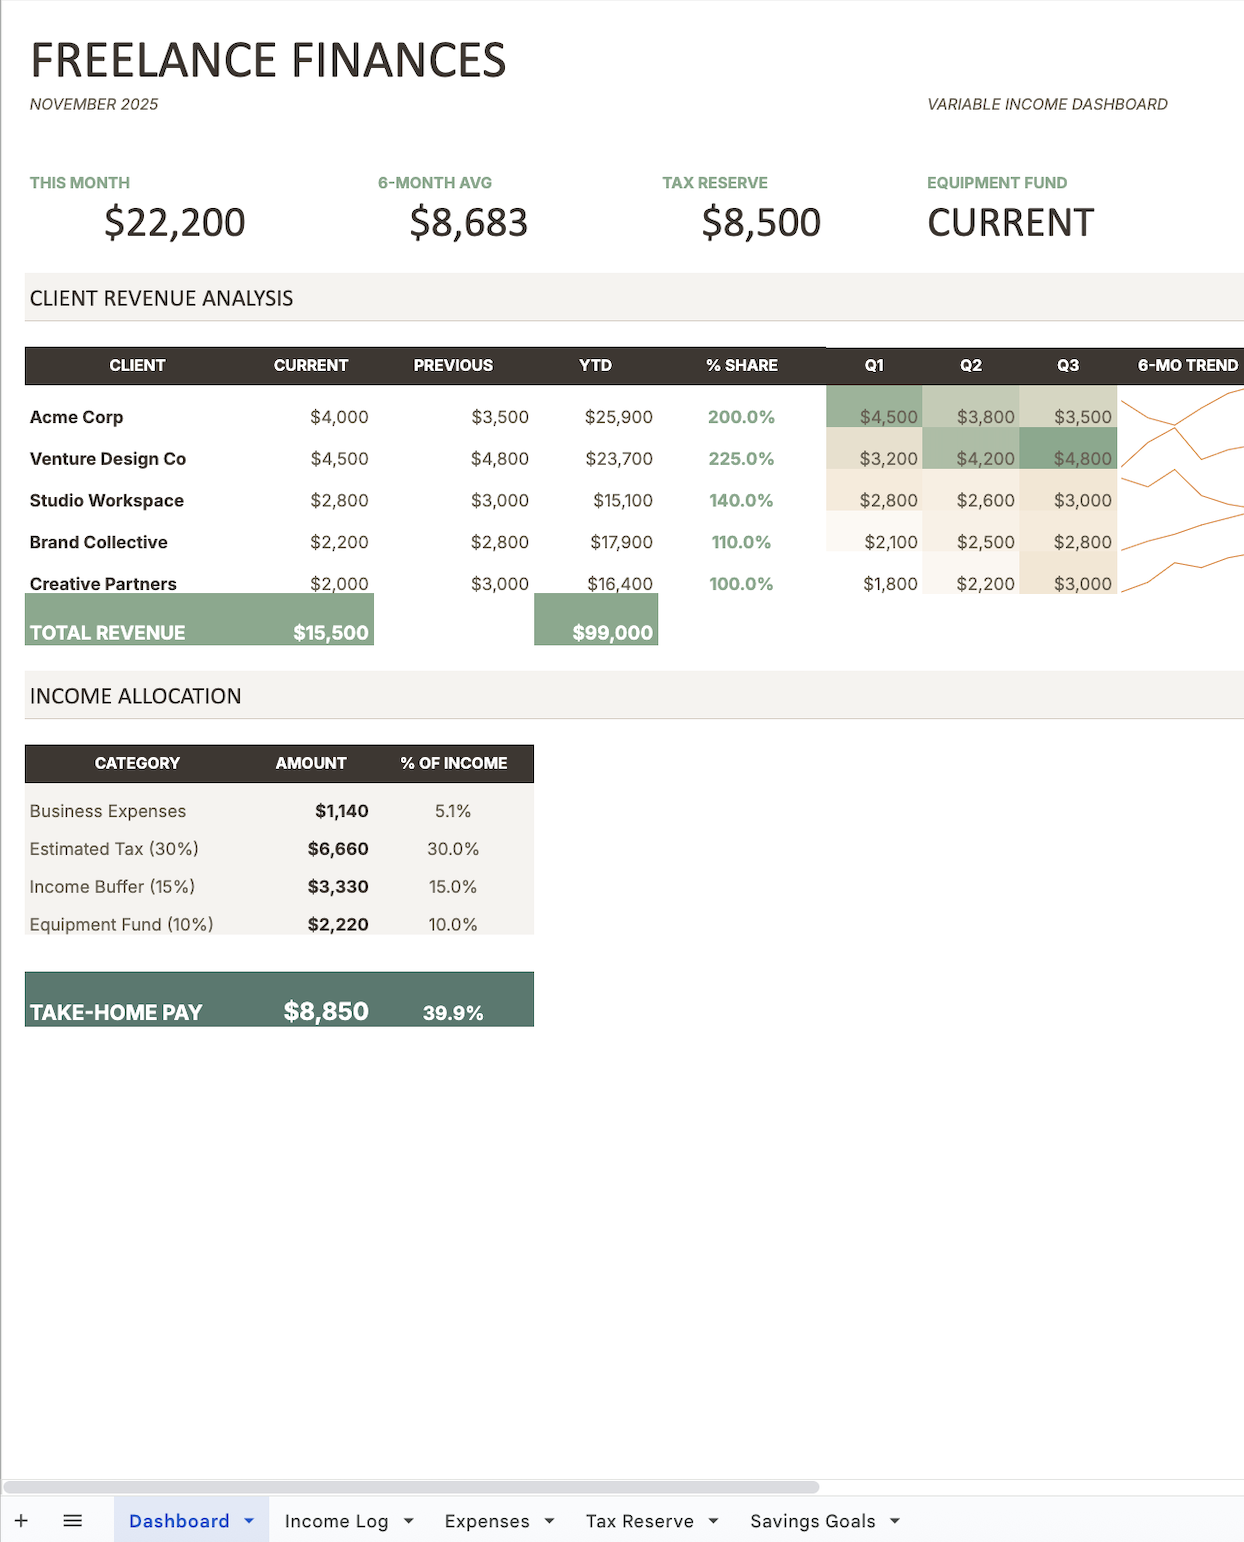
Done! I've created your freelance finances dashboard tracking November 2025.
Key highlights:
The dashboard shows your income allocation automatically: 30% to taxes ($6,660), 15% to your buffer ($3,330), 10% to equipment ($2,220), with $8,850 as take-home pay (39.9% of gross).
The quarterly breakdown lets you see client trends at a glance—Venture Design Co is ramping up while others stay steady. The sage green highlights on totals make it easy to scan your key numbers quickly.
View your dashboard
After seeing the dashboard, you can request improvements, like calculations, additional view, new features, without starting from scratch.
Can you add a column showing how many days it's been since each invoice? I want to see which pending payments are getting old.
Upload new invoice records and along with your dashboard file and Claude will update it with the latest data while keeping the same formatting and features.
Here's my dashboard from last month and my new December invoices. Can you add the new data and update the monthly totals?
The chat preview shows basic data structure, but the formatting and features only appear once you've opened the file. From there you can see the formatting, typography, and features like frozen headers, clickable filters on each column, and small trend charts. The preview gives you a sense of the content—the actual file has all the functionality.
Certain advanced features require Claude to use software packages, which are like specialized tool kits. For spreadsheet files, mentioning 'xlsxwriter' in your prompt enables features like sparklines (small inline trend charts), advanced conditional formatting, and sophisticated chart styling.
Claude can work with messy data and handle inconsistent date formats, blank rows, notes in cells, and mixed formatting. If you've been tracking invoices in whatever way worked for you, upload that. Claude organizes it during the process, so focus on making sure you have all your records rather than formatting them perfectly beforehand.