Build financial models
Create investment analyses with complete financial models, scenario planning, and risk evaluation.
Investment analysis means pulling data from research platforms, building financial models, and formatting to firm standards—work that can occupy analysts for days. Claude connects to your data sources and generates working models based on your deal parameters. You review the assumptions and edit directly in Excel with formulas intact, rather than building from scratch.
Tell Claude about your investment opportunity and what your partners need to see. Be specific about the deal parameters, key questions, and timeline.
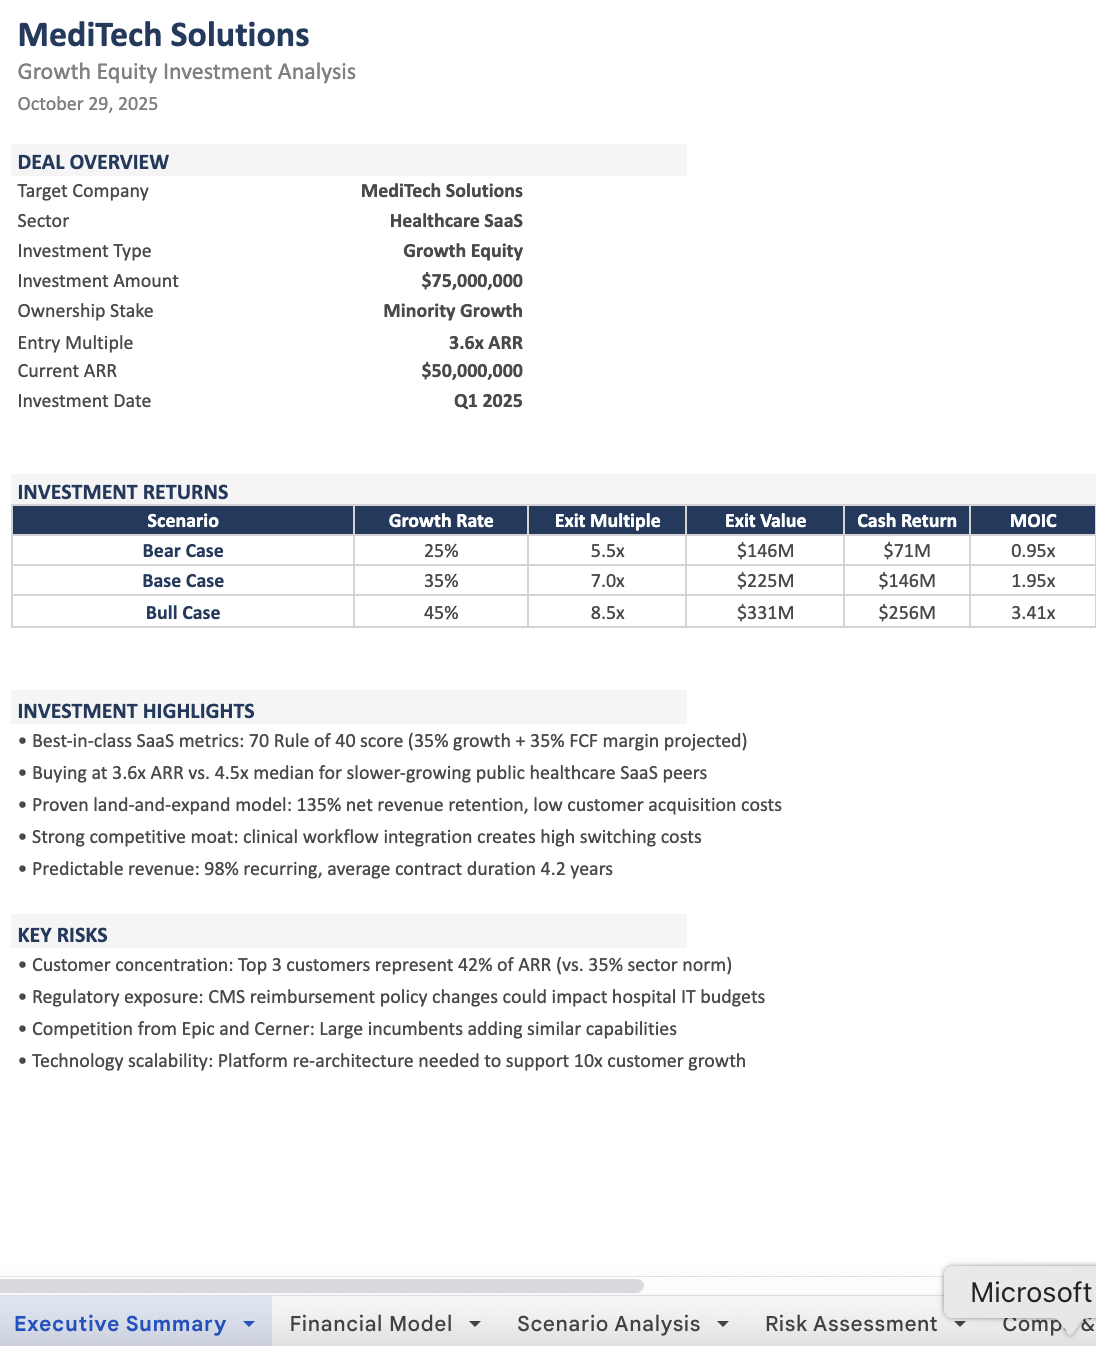
I'm evaluating MediTech Solutions (healthcare SaaS) and need a complete investment analysis.
Deal structure: $75M growth equity stake at 3.6x ARR entry, exit at 7.0x in year 5. Current metrics are $50M ARR growing 35% with 18% EBITDA margin.
Get the company financials from Daloopa - search for MediTech Solutions and pull their historical revenue, EBITDA margins, customer metrics, and growth rates.
Pull healthcare SaaS comparables from S&P Global - find public companies in the sector and get their current trading multiples, growth rates, and margin profiles. I need this to validate our 7.0x exit assumption.
Search the web for healthcare SaaS customer concentration benchmarks - the company mentioned their top 3 customers represent about 40% of revenue and I need to know if that's typical or concerning for this sector. Also look up recent healthcare SaaS growth trends to stress-test the 35% growth assumption.
Retrieve our IC template from Box - search the "IC Templates" folder and use the private equity model format as the structure.
Key questions to address: How do returns look if growth slows to 25% or 20%? What does the customer concentration risk mean for our downside scenario? How does our 7.0x exit assumption compare to where public healthcare SaaS companies are trading today?
Create an Excel model with scenarios (base, upside, downside), sensitivity analysis on growth and exit multiple, risk assessment focusing on customer concentration, and a comps table showing where public companies trade. Use sophisticated private equity formatting with premium visual quality, an intentional color scheme, working formulas, frozen panes, and conditional formatting.
Connect your data platforms so Claude conducts research and analysis based on current data rather than requiring manual gathering from multiple sources.
Use connectors to give Claude access to financial data providers. Browse through the connector library in your settings to find tools from trusted financial partners.
Enable connections to S&P Global, Daloopa, and Box so Claude can access your financial research stack.


Turn on Extended Thinking for complex multi-position analysis and to produce higher-quality workbooks with working formulas and charts.
Make sure Web Search is enabled so Claude can incorporate current market context and historical scenario precedents.
Claude pulled financials from Daloopa, analyzed healthcare SaaS comparables from S&P Capital IQ, built three-scenario projections with sensitivity analysis, and formatted the multi-sheet model to match your IC template standards.
I've created your investment analysis model.
Data sources used:
Model structure:
Customer concentration finding: The 42% concentration matches sector norms at this revenue scale. Web research shows similar-sized healthcare SaaS companies typically see this decrease to 25-30% as they cross $100M ARR through customer base expansion.
Exit multiple assumption: The 7.0x exit sits above current public comps (4.5x median) but below where faster-growing peers traded 18 months ago (8-10x range). Assumes market multiples recover partially and MediTech's growth premium commands a valuation spread.
All formulas are functional. Color coding follows PE standards (blue inputs, black calculations, green cross-sheet references).
View your financial model
Turn your financial model into a written investment recommendation. Claude converts the numbers and analysis into a narrative memo that explains the returns, risks, and why this deal makes sense.
Take the key insights from this model and create an investment memo. Use our standard IC template from Drive. Structure it with these sections: Deal Overview, Investment Thesis, Returns Summary, Key Risks, Recommendation.
Check if your projections match reality. Claude researches how similar companies actually grew at this stage and tells you if your forecast is reasonable or too optimistic.
These growth numbers feel optimistic. Pull actual growth trajectories from similar healthcare SaaS companies—either from our portfolio or public comps. Show me year-over-year growth rates for companies that started at $50M ARR. Does our path match reality or are we being too aggressive?
Use Research to find current transaction data across multiple sources. Research takes a few minutes but delivers a thorough report with verified citations. With financial data connectors enabled, Claude can cross-reference your internal knowledge with external market data.
Find healthcare SaaS exit transactions in the last 18 months for companies in the $50-100M ARR range. What multiples did they actually achieve? How does our 7.0x exit assumption compare to recent deals, not just public trading multiples?
Once you connect S&P Capital IQ or Daloopa, refresh comparable company multiples without manual updates. Say: "Pull latest healthcare SaaS comps and update the valuation sheet." Your benchmarking stays current as public market multiples shift.
Once Claude creates your financial model, download and open the file in Excel. With Claude for Excel, you can get instant explanations of any formula, test scenarios without breaking dependencies, or trace errors to their source. Claude provides cell-level citations for every calculation.Claude for Excel is currently in beta as a research preview. Join the waitlist to get access.
In addition to the ability to connect to financial data tools, Claude for Financial Services adds expanded services. In addition to financial data connections, receive specialized Skills for institutional-grade analysis and frameworks, such as those for financial analysis or valuation. Also receive expert implementation support through tailored onboarding, training, and best practices.